Workflow improvement is a near-constant need in any organization. When issues like bottlenecks, disruptions, miscommunication, or redundancies occur in a healthcare setting, creating process maps for improvement can help.
Workflow improvements increase efficiency, reduce waste, remove roadblocks, and enhance provider and patient experience by promoting higher-quality care. But before improving a workflow, the workflow needs to be mapped out and assessed as it currently operates. A useful and effective tool to accomplish this is called a process map, or flow diagram or flowchart.
What Is Process Mapping in Quality Improvement?
Prior to identifying areas of quality improvement and analyzing them, a workflow first needs to be clearly mapped out. A process map is a visual aid created to illustrate a sequence of tasks that occur between systems or people while completing work or passing data from one team to another. Process maps are flexible, and should be updated as workflows are amended by improvement teams.
Identifying that improvement is needed can be the easy part; but how do you go from knowing there’s a problem to implementing effective solutions?
How to Create Process Maps for Improvement
Process maps are used for purposes such as:
- To build team consensus on a full process, start to finish.
- To identify variation and gaps.
- To identify value added steps (steps of process in which customer perceives that there is value) vs. non-value added steps (steps of process that do not directly contribute to the service or product).
- To illustrate relationships between multidisciplinary workflows, providing an understanding of high-level workflows, systems, and communication.
- To identify potential impact of a new solution on administrative and clinical workflows.
- To document and analyze processes prior to implementing an improvement intervention, such as an IT solution meant to optimize performance. Process mapping can help to ensure that a new tool or solution can fit into the workflow model without causing major disruption.
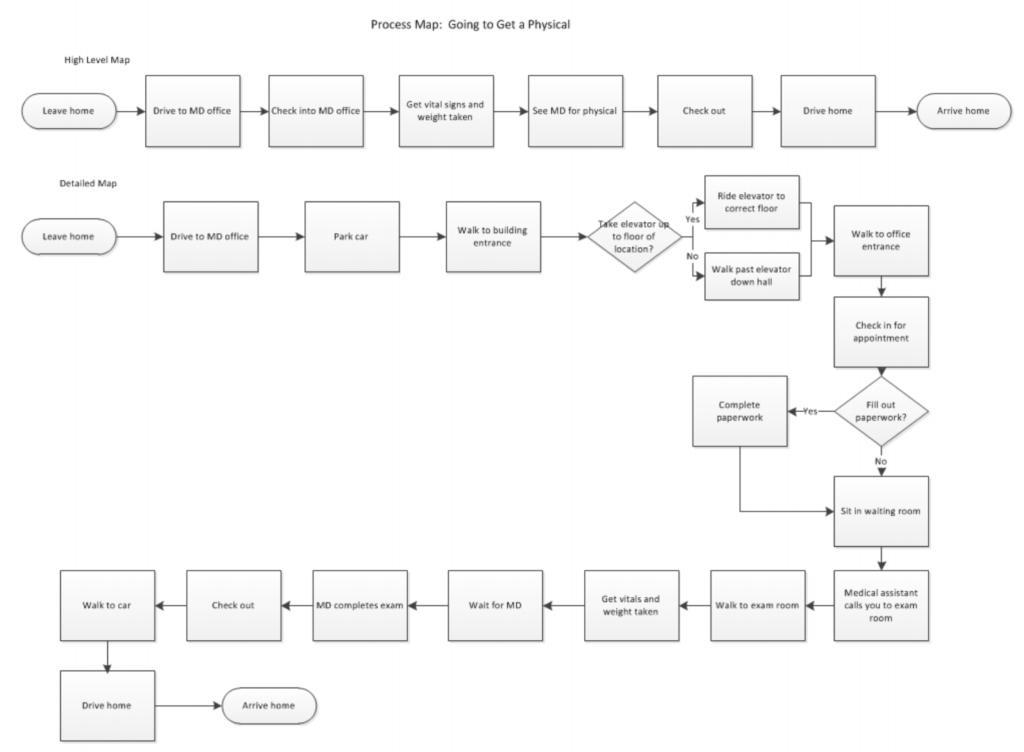
When creating a process map, a designated set of symbols are used to indicate various steps in the process, such as start and end points, activities, and decision points. An arrow symbol is used to illustrate the flow between these steps.
Process Map Example
The standardized set of symbols used in process mapping and diagramming is specified by the Unified Modeling Language, which allows for a universal understanding of the graphics used in visual process documentation and flow diagrams.
Digital workflow tools and template options allow you to create process maps using standard language and symbols across virtually any industry and improvement need.
According to the Agency for Healthcare Research and Quality, there are nine workflow assessment tools that are utilized to describe tasks, document and demonstrate movement through a process, visually identify problems within a process, and hypothesize courses of action and potential results.
The nine workflow assessment tools include: workflow diagrams, use cases, value stream mapping, value-added analyses, flowcharts, cycle time charts, decision action diagrams, decision trees, and hierarchical task analyses.
Benefits of Process Maps for Improvement
Process mapping tools allow teams to communicate a process clearly and objectively, gain a shared understanding of the process, and allow improvement teams to identify implications of change prior to implementation.
Process diagrams help teams to discover inefficiencies or roadblocks in areas previously unidentified, perhaps due to siloed departments. They can help teams clarify issues, identify roots of problems, and discover improvements within multidisciplinary systems.
Process diagrams can be high level or detailed. High-level diagrams show only the major steps in a process, are easiest to construct, gain quick group consensus, and inform measurement. They should be used as a first step, if a team needs a broad or quick overview. Detailed diagrams show all activities in a process and identify specifically where efficiencies and improvements can be made.
Use process maps for improvement to discover inefficiencies and breakdowns that currently occur in a workflow, and explore potential courses of action by outlining potential risks and rewards of change. An understanding of your current workflow will allow you to identify and analyze areas for improvement and implement synergistic solutions to mend costly workflow problems.

Recent Comments